Flint debugging
Here are few tips in order to ease debugging of BLISS display in Flint.
First of all, Flint does not run in the same process than BLISS, it uses it’s own process.
This allows the GUI to segfault without breaking the sequencer. But it can make the debugging a little more complex.
Logging inside Flint
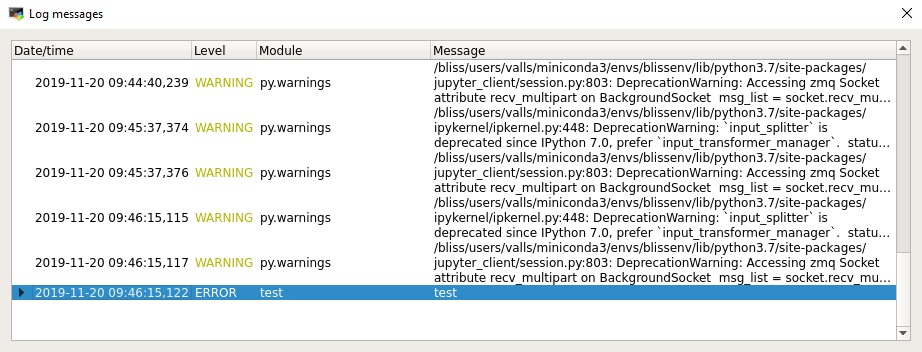
Flint can display logs on a separated window using the standard python logging system.
To show Log messages window:
- Menu:
Windows↴Show log. - or
Ctrl-Lshortcut
All the caught exceptions will be displayed there.
Flint stdout/stderr in BLISS shell
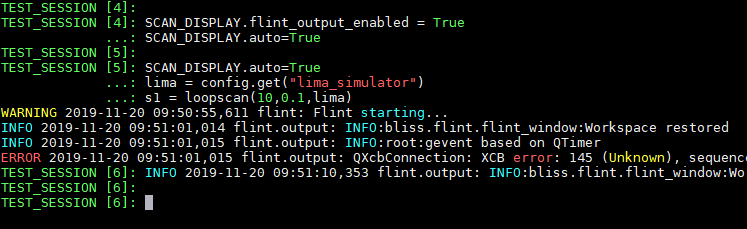
Flint standard output streams can be displayed inside bliss.
It allows to display not only information from the logging system, but also other things uncaught.
This is disabled by default. It can be enabled via SCAN_DISPLAY:
SCAN_DISPLAY.flint_output_enabled = True
All the outputs from Flint will be redirected to the BLISS session.
- If Flint was created by this BLISS process, the output comes from 2 pipes (for both output).
- If Flint was attached, the output comes from 2 sockets created on depend (for both output).
This technique does not allow to catch the early output.
Flint stdout/stderr in a console
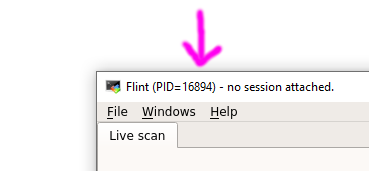
Flint can be create independently and then attached to a BLISS session. This way, early logs can be displayed.
First create flint:
python -m bliss.flint
The header of the Flint window will display the PID of the process.
This information must be used in order to attach the Flint process to BLISS.
Then, from the BLISS session:
from bliss.common import plot
plot.attach_flint(PID)
IPython
Flint also provides an IPython console embedded in the GUI.
To show the console:
- Menu:
Help↴IPython console.
Note
The console can be detached from the main window to avoid to loose display space.

This IPython session contains 2 initial objects:
window: a reference to the main Qt window of Flint.flintState: a reference to all the data and process provided by Flint.
Here is a way to check a channel’s data which was received by Flint:
scan = flintState.currentScan()
channel = scan.getChannelByName("lima_simulator:image")
array = channel.data().array()
# Here we have a numpy array
array.shape
This can be used to check the structure of a plot (a plot is about modelization, not about widget and GUI):
workspace = flintState.workspace()
plots = workspace.plots()
plot = plots[0]
# For a plot of curves, this will list each displayed curves
plot.items()